
Measure the Cost of Engineering Data Rework
Measure engineering data rework by recording incident-specific labor and verified direct costs. Separate waiting from active labor, avoid counting correction twice, and keep observed cost distinct from any prediction about software savings.
Engineering managers deciding whether missing files or uncertain revisions justify a focused improvement project.
Capacity recovered is not automatically cash savings or software ROI.
Measure engineering data rework at the incident level
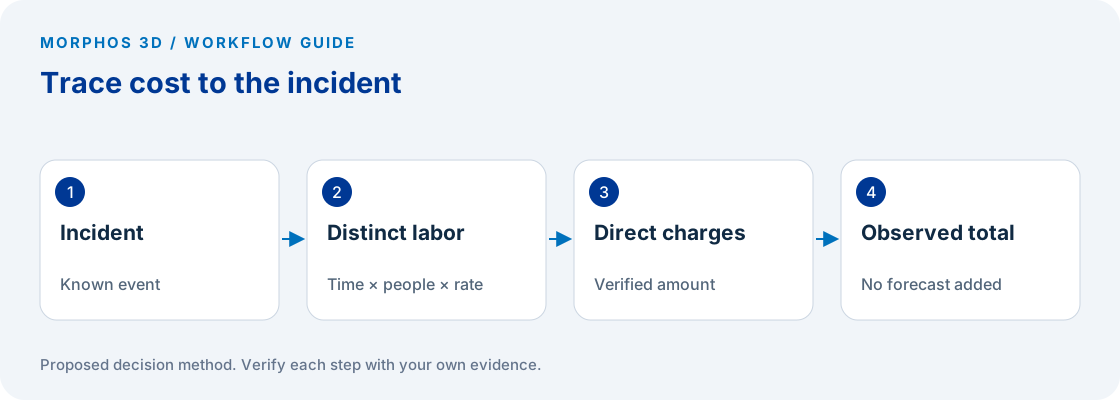
A missing file can cause several different costs: someone searches, someone reconstructs work, and another person may correct an output that used the wrong information. Start with the incident and the actions it caused rather than applying a general productivity percentage to the whole department.
Give each incident an identifier and record the affected deliverable. Preserve enough evidence to establish what happened, such as a work log, correction record or approved cost entry. Do not infer the cause from a frustrated message alone; the missing information may be a naming problem, an approval ambiguity or an actual loss of data.
Choose a consistent observation window and include quiet days as well as difficult ones. A log assembled only from memorable failures will exaggerate how representative those failures are. State the coverage and any gaps before reporting a total.
Calculate labor from people and active time
For each non-overlapping activity, multiply active hours by the number of people performing that activity and the approved hourly cost rate. If different people have different rates or durations, use separate rows. The calculator below accepts one common rate per incident summary; use the downloadable worksheet for more detailed labor categories.
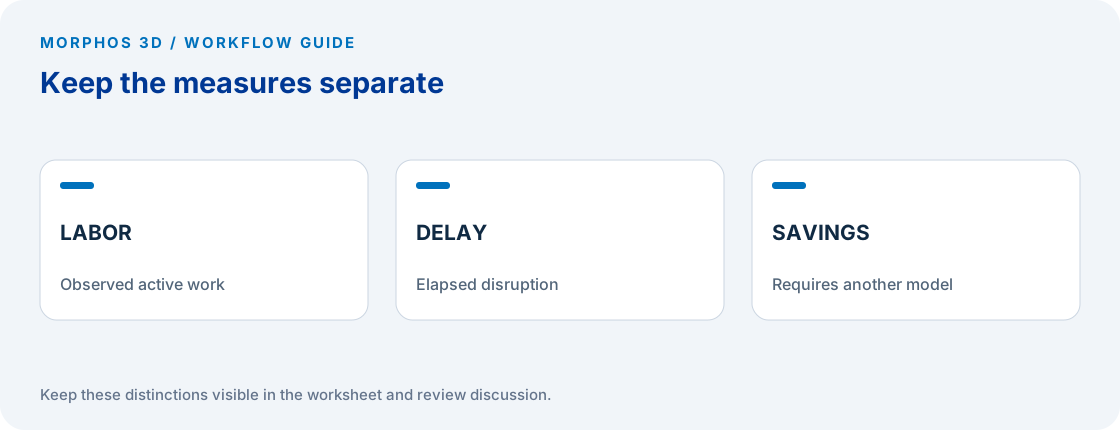
Waiting is not automatically active labor. If a person can perform other useful work while a file is recovered, record the elapsed delay separately. If the person is genuinely blocked, have the responsible manager determine how that time should be represented in the business case.
Keep search, reconstruction and correction categories mutually exclusive for each block of time. Moving the same twenty minutes into two categories doubles the cost without adding evidence. The worksheet should make it possible for someone else to reconstruct the total from the underlying entries.
Add direct costs only when they are supported
Record verified scrap, outside services or other incident-specific charges separately from labor. Identify the accounting basis and the person who confirmed the amount. Do not add a general machine burden charge if the same labor or overhead is already included elsewhere in the estimate.
Keep delayed revenue, missed delivery consequences and opportunity cost outside the simple calculator unless finance supplies a defensible method. These effects can matter, but adding a speculative sale value to a measured engineering-time log makes the total difficult to interpret.
Report the observed period and currency beside the result. Comparing amounts from different currencies or periods without conversion and context is not a meaningful trend. If you later annualize the result, label the frequency assumption and show the observed total separately.
Put the method to work
Bring a small incident log and the recurring cause you want to investigate.
Use the worksheet belowKeep recovery evidence separate from the cost estimate
A business-impact log does not prove that files can be restored. For SOLIDWORKS PDM, the 2026 installation guide describes coordinated database and archive backups and the additional records required for restoration. It also notes that locally modified, checked-out work is outside the backed-up vault content. SOLIDWORKS PDM 2026 Installation Guide.
Ask the system owner for the latest restore-test evidence and the scope it covered. Do not attempt a production restore as part of measuring an incident. Recovery procedures belong with the authorized administrator and the applicable system documentation.
Treat “file recovered” and “job resumed correctly” as separate observations. After a recovery, the responsible users still need to confirm the required data and approved information. A cost log can record the time spent doing that work without pretending to certify the recovery process.
Use the result to choose an intervention
Group incidents by the verified failure mechanism. Repeated time spent identifying revisions points toward release and distribution controls; repeated reconstruction after a loss points toward recovery capability. Similar cost totals can therefore lead to very different corrective actions.
A reduction in recorded labor represents capacity that may become available for other work. It does not automatically reduce payroll or establish a cash return on a software purchase. Any investment comparison also needs implementation effort, operating cost, adoption assumptions and evidence that the chosen change addresses the measured cause.
After a pilot change, collect the same incident measures over a comparable period. Report changes in workload and reporting coverage so the comparison remains interpretable. The first useful outcome is a defensible problem statement, followed by evidence about whether the intervention reduced that problem.
Checks to carry into the discussion
| Cost element | Calculation or record | Exclude |
|---|---|---|
| Search labor | Active hours × people × approved hourly rate | Elapsed time spent on other work |
| Reconstruction labor | Distinct active time rebuilding lost work | Time already counted as search |
| Correction labor | Distinct active time correcting the affected output | The same labor in a scrap burden rate |
| Direct incident cost | Verified accounting amount | Speculative revenue or unsupported penalties |
| Observed total | Labor plus non-overlapping direct costs | Automatic annual savings or ROI |
Download the working worksheet
Enter one row for each distinct activity and preserve the evidence reference. Confirm rate and direct-cost treatment with the person responsible for the business case. The calculator is intentionally blank until you enter values, and its chart displays only those entries. It does not submit the figures to a server. Use one currency throughout a calculation, and retain the worksheet if the result will support an investment discussion.
Fields: Incident ID · Observation date · Cause confirmed by · Activity · Active minutes · People · Hourly rate · Currency · Labor cost · Verified direct cost · Evidence reference · Elapsed delay separately · Double-count check.
The worksheet and decision method are original Morphos 3D guidance. Fill them with your own evidence; the file contains no customer data or assumed results.
Calculate one observed incident
Enter non-overlapping active minutes. Use one common hourly rate and one currency for this incident. Different rates or durations require separate worksheet rows. No figures are sent to a server.
Enter all six values to calculate. Enter zero for an activity with no cost.
No result yet
Formula: (search + reconstruction + correction minutes) ÷ 60 × people × hourly rate + verified direct cost. This is observed incident cost, not forecast savings or ROI.
Bring a small incident log and the recurring cause you want to investigate.
Capacity recovered is not automatically cash savings or software ROI.
Frequently asked questions
Does recovered engineering time equal cash savings?
No. It can represent available capacity. Cash savings require a separate explanation of which expenditure will actually change.
Can this calculator estimate software ROI?
It measures entered incident cost. ROI additionally requires the cost of the proposed change and evidence about how much of the observed problem it will prevent.
Official references and method
References reviewed October 5, 2026. Product references support the specific capabilities discussed; the worksheets and decision steps are proposed guidance, not vendor benchmarks.
Discuss the next test
Bring a small incident log and the recurring cause you want to investigate.